Supply Chain Disruptions and Price Effects
Explore how logistics bottlenecks, port delays, and shipping constraints impact Malaysian import costs and consumer prices across sectors.
Understanding Supply Chain Pressures
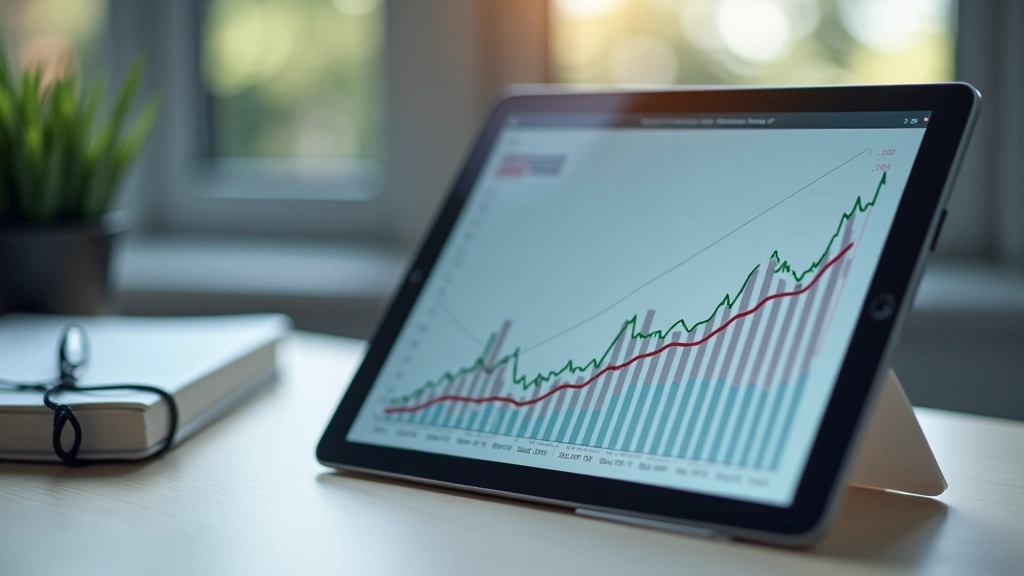
When ships can’t dock on schedule or containers pile up at ports, prices don’t stay put. Supply chain disruptions create a direct line from logistics bottlenecks to what you pay at the store. It’s not just inconvenience — it’s inflation working through real-world constraints.
Malaysia’s economy depends heavily on imports. We bring in raw materials, components, and finished goods from around the world. When these flows get blocked or delayed, production slows, inventories shrink, and costs climb. This isn’t theoretical — it’s happening right now across electronics, food, and manufacturing sectors.

The Disruption Cascade
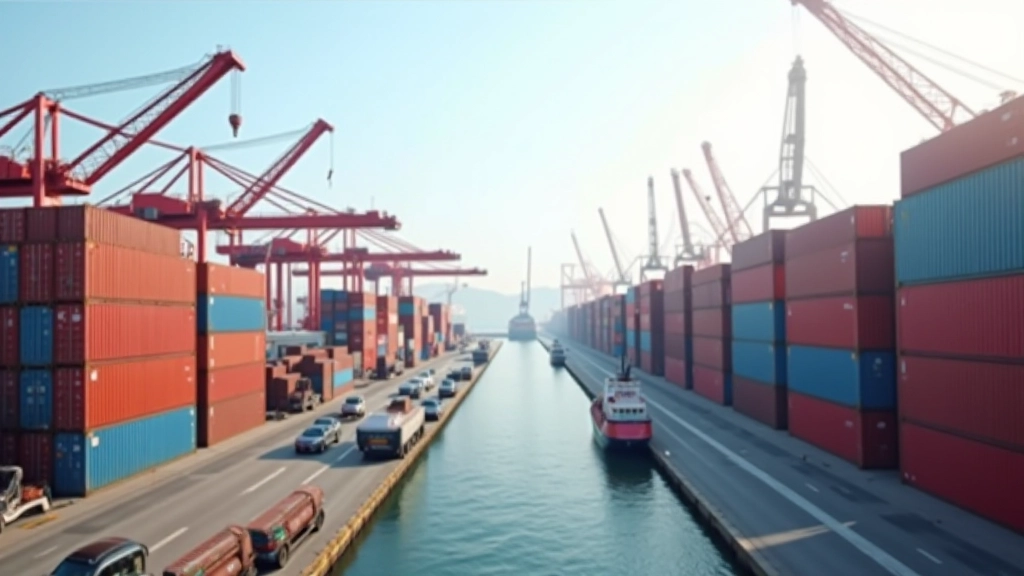
Port congestion creates the first bottleneck. A ship arriving late means containers sit waiting — sometimes for weeks. Every day a container’s delayed adds cost. Handling fees accumulate. Storage charges mount. These aren’t small numbers — a single delayed shipment can add 5-15% to the cost of goods moving through Malaysian ports.
Then there’s the ripple effect. When importers can’t predict delivery dates, they either order more (to hedge against delays) or order less (to avoid being stuck with inventory). Both strategies push prices up. Extra orders drive spot market prices higher. Reduced orders mean longer lead times from suppliers, who then charge premiums for expedited handling.
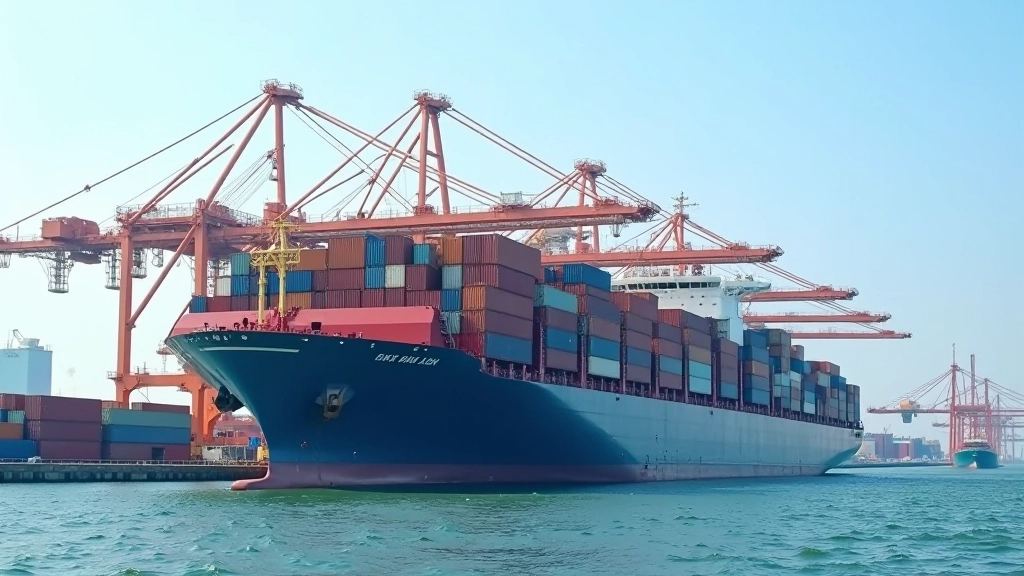
Shipping rates themselves become volatile. Container rates from Shanghai to Port Klang ranged from $800 to $3,500 per container in recent years — a 400% swing. When freight costs jump that dramatically, manufacturers pass it straight to retailers, who pass it to consumers.
Price Effects Across Sectors
Electronics & Semiconductors
Supply chain delays hit semiconductors hardest. A shortage in Taiwan’s chip exports means Malaysian assembly plants sit idle. When production stops, fixed costs spread across fewer units. A smartphone that should cost $400 ends up at $480 because the chip component got held up for 6 weeks.
Food & Agriculture
Fresh goods don’t wait. When container ships delay, perishable items spoil. That pushes farmers to source locally at higher costs, or import at expedited rates. Prices for imported vegetables, cooking oil, and grains rise 10-20% during peak disruption periods.
Manufacturing & Industrial
Factory input delays force production halts. Idled workers still draw wages. Equipment sits unused. These overhead costs inflate the per-unit cost of everything from construction materials to automotive parts by 8-12%.
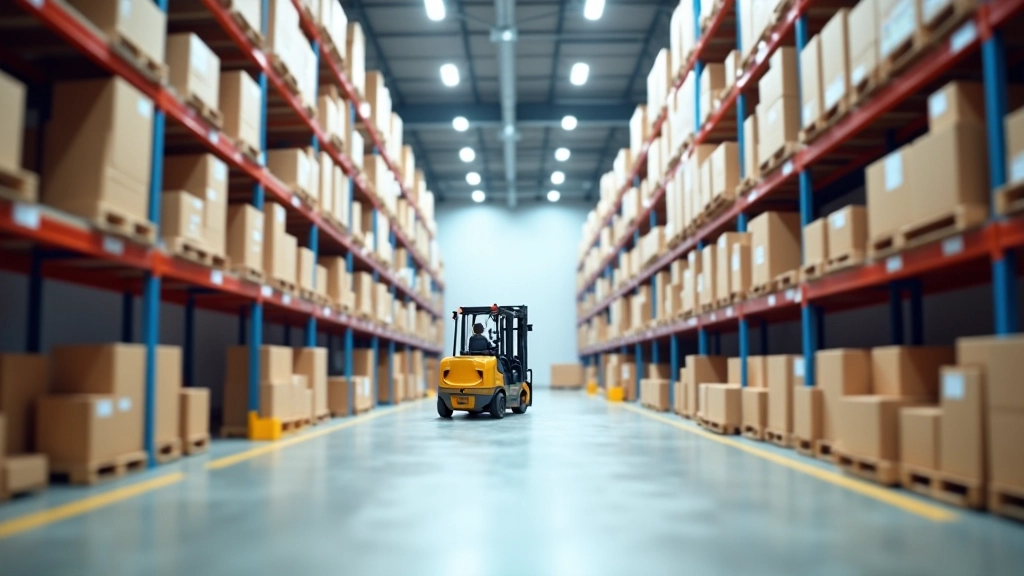
Retail & Consumer Goods
Retailers face inventory uncertainty. They either stockpile (paying storage costs) or risk stockouts (losing sales). Both drive retail prices up. Consumer goods that should cost $20 climb to $24-26 within months of major disruptions.
How Disruptions Become Price Increases
The path from port delay to shelf price is direct. Here’s how it works in practice:
Capacity Constraints
Ports reach maximum capacity. Queues form. Ships wait offshore for berths. This creates a bottleneck that affects everything moving through that port.
Cost Accumulation
Demurrage charges (fees for delayed containers) stack up. Handling costs increase. Storage fees apply. A container that should have cost $2,000 to move now costs $2,800.
Supplier Response
Suppliers pass costs downstream. Importers increase purchase prices by 3-8%. Wholesalers add their margin. Retailers add theirs. The cost multiplier compounds through each level.
Consumer Impact
Final prices rise. What cost RM 100 three months ago costs RM 108-112 now. For essentials like food and fuel, this creates visible inflation that shows up in CPI data.
Identifying Supply Chain Pressure in Data
How do economists spot supply chain disruptions causing inflation? They look for specific signals:
Container wait times exceed 5 days (normal is 1-2 days). This directly correlates with 2-4% price increases within 4-6 weeks.
Freight costs jump 20%+ month-over-month. This precedes retail price increases by 2-3 months.
Importers move orders earlier (front-loading) or later (back-loading) to avoid delays. This creates demand spikes that push prices up immediately.
Retail inventory levels drop suddenly (uncertainty-driven reduction) or spike (precautionary stockpiling). Both lead to price increases within weeks.

“Supply chain disruptions don’t just delay goods — they rewrite the economics of moving them. When a shipping container takes 8 weeks instead of 4 to reach Port Klang, that’s not a logistics problem anymore. It’s an inflation problem.”
— Supply Chain Economics, Trade Flow Analysis 2026
The Real Cost of Delays
Supply chain disruptions create tangible price effects that show up in your monthly expenses. A port delay becomes a grocery bill increase. A shipping rate spike becomes a higher car price. These aren’t coincidences — they’re the direct mechanics of how logistics constraints translate to inflation.
Understanding this mechanism helps explain why prices sometimes rise even when demand isn’t particularly strong. It’s not always demand-pull inflation. Sometimes it’s supply-side constraints forcing costs upward. Malaysia’s import-dependent economy makes us especially sensitive to these disruptions.
Watching port congestion data, shipping rates, and container wait times gives you an early warning system. When these metrics spike, consumer prices typically follow within 6-8 weeks. It’s not perfect prediction, but it’s a reliable indicator that cost-push pressures are building through supply chain channels.
Informational Purpose
This article provides educational information about supply chain disruptions and their economic effects. The analysis presented is for informational purposes only and should not be considered economic advice or investment guidance. Supply chain impacts vary significantly by sector, timing, and regional factors. For specific economic analysis relevant to your situation, consult qualified economists or trade specialists. Data points and timeframes mentioned are illustrative examples based on historical patterns and may not apply to all circumstances.